
¡Saludos a todos! En esta ocasión, estoy emocionado por compartirles cómo realizar una visualización gráfica en una pantalla OLED de 2.4 pulgadas utilizando Arduino. Acompáñenme mientras exploramos las conexiones y el funcionamiento de este proyecto que incluye la simulación de un sensor mediante un potenciómetro. Este proyecto es altamente personalizable, permitiendo adaptar la visualización según las necesidades específicas de cada usuario..
Pantalla OLED 2.4″ como I2C:
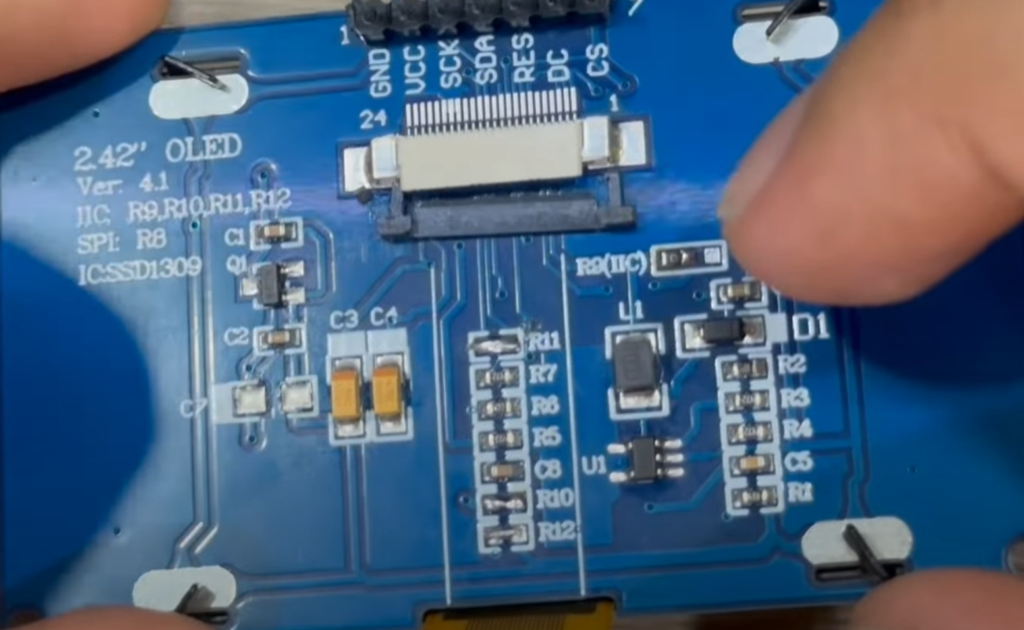
La pantalla OLED de 2.4 pulgadas utilizada en este proyecto tiene 7 pines y una resolución de 128 x 64, similar a la OLED de 0.96 pulgadas. Para utilizarla en modo I2C, desconectamos el flex de la pantalla y realizamos los puentes sugeridos en la parte trasera (conexión de R9, R10, R11 y R12 mediante puentes de soldadura). Estos ajustes son cruciales para garantizar su correcto funcionamiento.
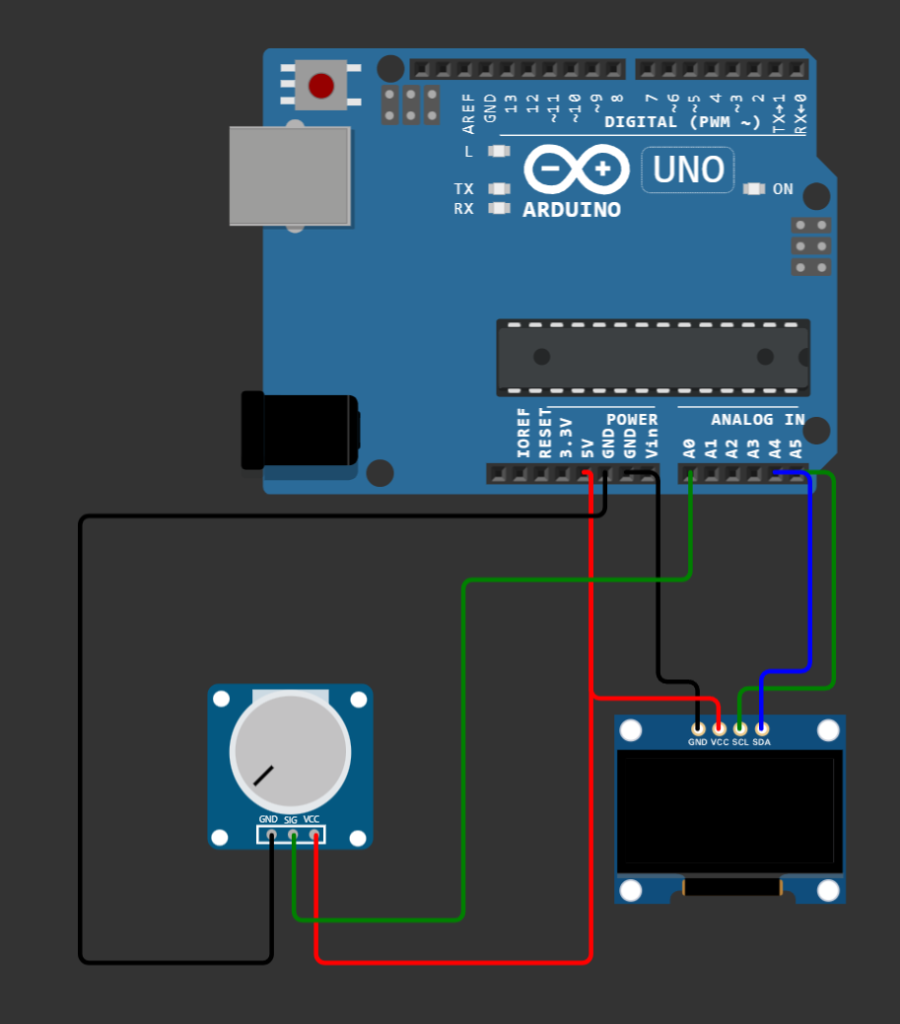
Conexiones Oled y Arduino:
| Pantalla Oled | Arduino |
| 5V | 5V |
| SDA | A4 |
| SCL | A5 |
| GND | GND |
Código Arduino:
#include <Arduino.h>
#include <U8g2lib.h>
#include <SPI.h>
#include <Wire.h>

U8G2_SH1106_128X64_NONAME_1_HW_I2C u8g2(U8G2_R0);

unsigned long startMillis;
unsigned long currentMillis;
unsigned long time_passed;
unsigned long lastReset;

const unsigned long period = 25;

const int sensorHistoryLength = 128;
int sensorHistory[sensorHistoryLength];
int sensorHistoryPos = sensorHistoryLength - 1;
float sensorData;
int boostMax = 1600;
int BoostMaxTop = 0;
int boostMin = 0;
float inbar;
float maxinbar;

const char* type="Analog Reads";
const char* unit = "Volts";

void setup(void) {
  u8g2.begin();
  startMillis = millis();
  time_passed = millis();
}


void loop(void) {
  // Only read from the sensors every 50 ms
  currentMillis = millis();
  if (currentMillis - startMillis >= period) {
    readSensorData();
    startMillis = currentMillis;
    // Set Max Boost Value
    if (sensorData >= BoostMaxTop)
    {
      BoostMaxTop = sensorData;
    }
    else if (sensorData <  BoostMaxTop)
    {
      if (millis() - lastReset > 5000) {
        lastReset += 5000;
        time_passed = 0;
        BoostMaxTop = sensorData;
      }
    }
  }

  u8g2.firstPage();
  do {
    // Draw current data
    u8g2.setFont(u8g2_font_fub20_tf);


    if(analogRead(A0) == 0)
    {
      sensorData = 0;
      BoostMaxTop = 0;
    }

    // Change analog to BAR
    inbar = sensorData*1.0;
    char cstd[6];
    dtostrf((float)inbar, 1, 1, cstd);
    u8g2.drawStr(0, 20, cstd);
		u8g2.setFont(u8g2_font_helvR08_tf);
    u8g2.drawStr(10, 42, type);
    // Draw max pressure
    u8g2.setFont(u8g2_font_fub11_tf);
    // Change Analog to Vol
    maxinbar = (BoostMaxTop * 5.0)/1023.0;
    char csta[6];
    dtostrf((float)maxinbar, 1, 1, csta);

    int yPos = u8g2.getStrWidth(csta);
    u8g2.drawStr(128 - yPos, 11, csta);

    drawBarGraph(0, 22, 125, 8);
    drawGraph(0, 32, 125, 31);
		u8g2.setFont(u8g2_font_helvR08_tf);
    u8g2.drawStr(100, 23, unit);

  } while ( u8g2.nextPage() );
}


void readSensorData(void) {
  sensorData = analogRead(A0);
  addSensorHistory(sensorData);
}

void addSensorHistory(int val) {
  sensorHistory[sensorHistoryPos] = val;
  sensorHistoryPos--;
  if (sensorHistoryPos < 0) sensorHistoryPos = sensorHistoryLength - 1;
}

int getSensorHistory(int index) {
  index += sensorHistoryPos;
  if (index >= sensorHistoryLength) index = index - sensorHistoryLength;
  return sensorHistory[index];
}

// Display functions
void drawGraph(int x, int y, int len, int height) {
  // Draw the lines
  drawHorizontalDottedLine(x, y, len);
  drawHorizontalDottedLine(x, y + height, len);

  int absMin = abs(boostMin);
  int range = absMin + boostMax;

  // Draw 0 line
  int zeroYPos = mapValueToYPos(absMin, range, y, height);
  drawHorizontalDottedLine(x, zeroYPos, len);

  // Draw the graph line
  for (int i = 0; i < 128; i++) {
    // Scale the values so that the min is always 0
    int valueY = getSensorHistory(i) + absMin;

    // Calculate the coordinants
    int yPos = mapValueToYPos(valueY, range, y, height);
    int xPos = len - i;
    if (yPos < zeroYPos) {
      // Point is above zero line, fill in space under graph
      u8g2.drawVLine(xPos, yPos, zeroYPos + 1 - yPos);
    } else {
      // Point is below zero line, draw graph line without filling in
      u8g2.drawPixel(xPos, yPos);
    }
  }
}

void drawBarGraph(int x, int y, int len, int height) {
  if (sensorData > 0) {
    // Draw the pressure bar behind the graph
    int barLength = ((float)sensorData / boostMax) * len;
    u8g2.setDrawColor(2);
    u8g2.drawBox(x, y, barLength, height);
    u8g2.setDrawColor(1);
  }
}

// Maps a value to a y height
int mapValueToYPos(int val, int range, int y, int height) {
  float valueY = ((float)val / range) * height;
  return y + height - (int)valueY;
}

void drawHorizontalDottedLine(int x, int y, int len) {
  for (int i = 0; i < len; i++) {
    if (!(i % 4)) u8g2.drawPixel(x + i, y);
  }
}
Simulacion:
Métodos Clave:
readSensorData: Lee y almacena el valor del potenciómetro en un vector FIFO de 128 posiciones.
getSensorHistory: Lee todos los valores almacenados en el vector.
drawGraph: Pinta la gráfica en la pantalla utilizando la información del vector.
drawBarGraph: Crea una barra que varía con cada lectura análoga.
Conclusiones y Proyecciones Futuras:
Este proyecto ofrece una solución gráfica efectiva y altamente adaptable para visualizar datos en tiempo real. Invitamos a cada uno de ustedes a ajustar este proyecto según sus propias necesidades y explorar las posibilidades que Arduino y las pantallas OLED ofrecen.
Esperamos que encuentren útil este proyecto y que les inspire para futuras creaciones. ¡A disfrutar del fascinante mundo de la visualización gráfica con Arduino y pantallas OLED!